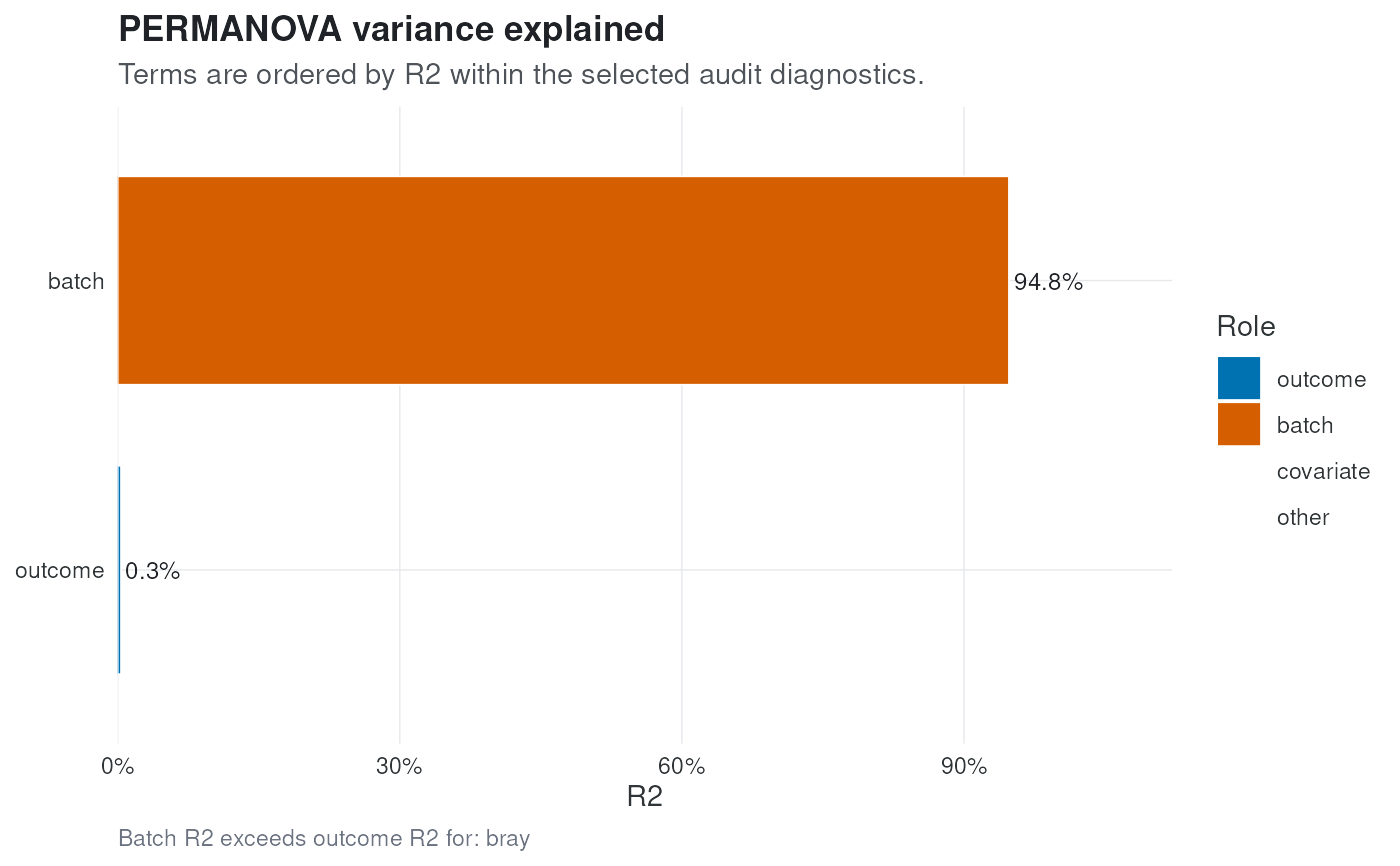
plot_variance() visualizes the PERMANOVA R2 terms stored by the batch
audit. Outcome, batch, covariate, and other terms are colored separately so
batch dominance is easy to inspect.
Value
A ggplot2::ggplot() object.
plot_variance() visualizes the PERMANOVA R2 terms stored by the batch
audit. Outcome, batch, covariate, and other terms are colored separately so
batch dominance is easy to inspect.
A ggplot2::ggplot() object.