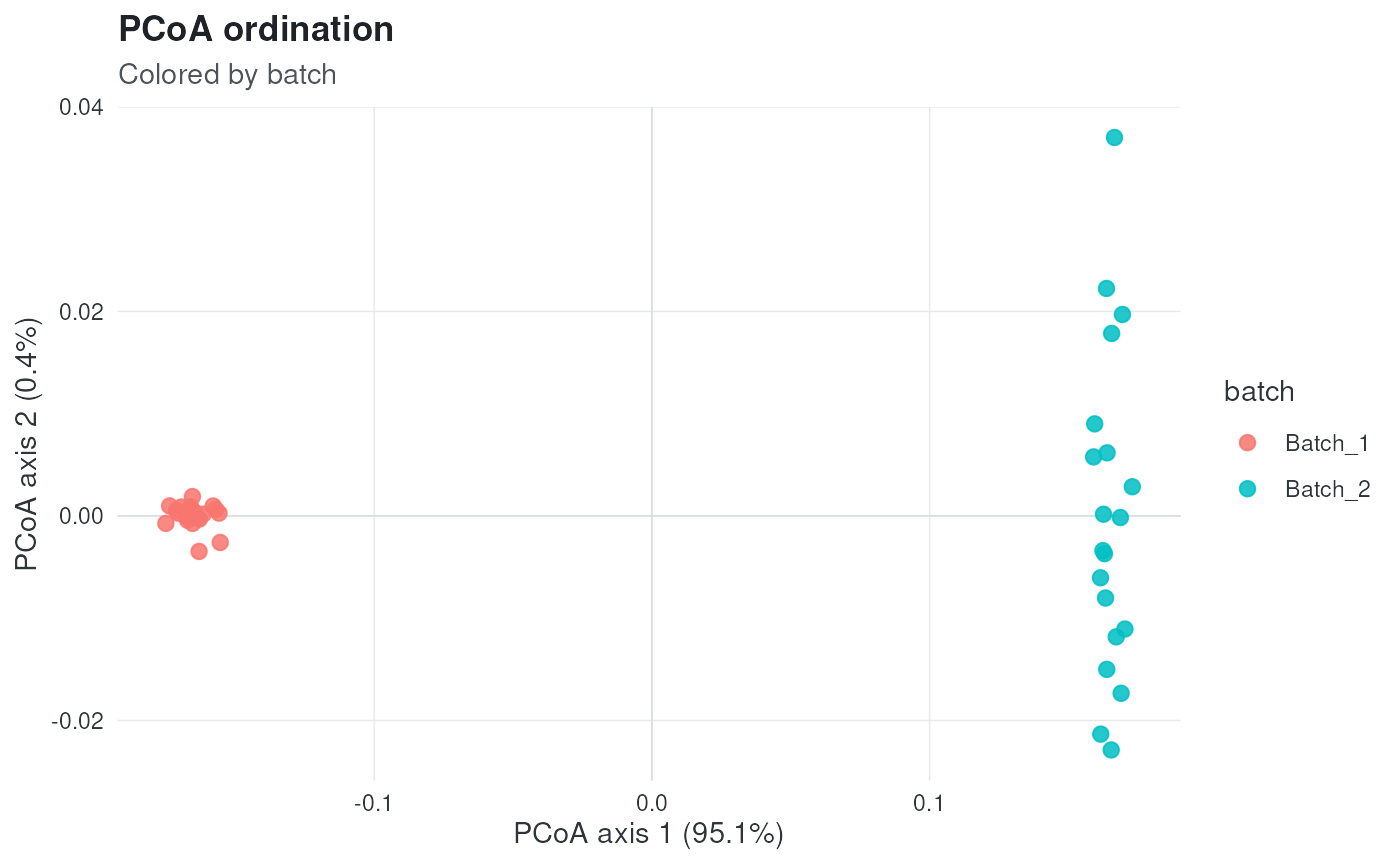
plot_ordination() visualizes the first two PCoA axes stored by
check_batch(). Points can be colored by any audited outcome, batch, or
covariate variable stored with the ordination coordinates.
Usage
plot_ordination(
  audit,
  color = NULL,
  distance = NULL,
  aspect = c("auto", "equal")
)
Arguments
- audit
A
moat_auditobject.- color
Optional single string naming a metadata variable. When
NULL, the first batch variable is used when available, otherwise the outcome.- distance
Optional character vector naming audited distances to plot. When
NULL, the first available distance is used. Use"all"to plot all audited distances.- aspect
A single string controlling panel aspect.
"auto"uses the available plotting space and is easier to read when PC1 and PC2 have very different ranges."equal"preserves a 1:1 coordinate ratio.
Value
A ggplot2::ggplot() object.