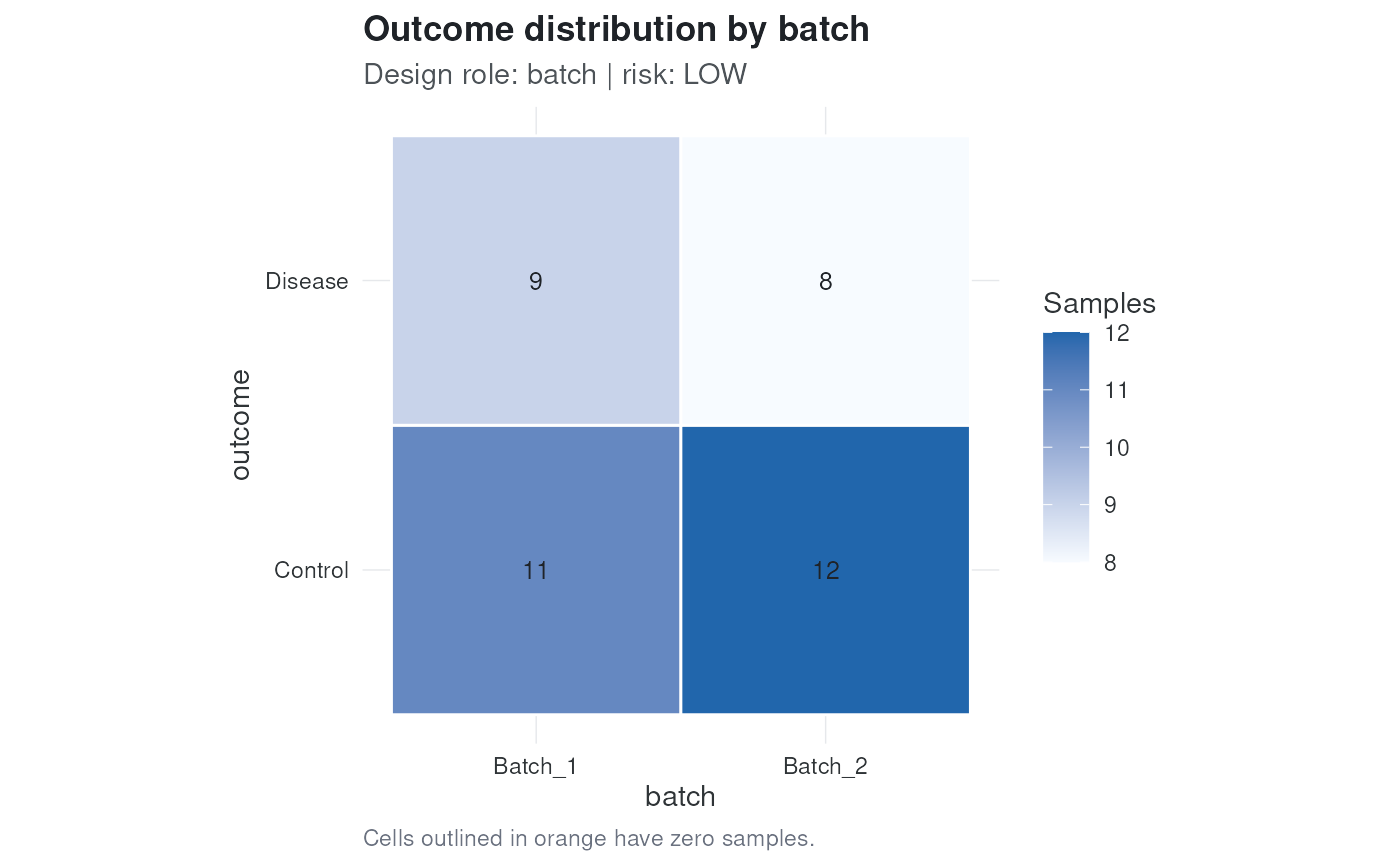
plot_design() visualizes the contingency table stored by the design audit
for a categorical batch or covariate variable. Empty cells are outlined so
confounding and complete separation are visible at a glance.
Usage
plot_design(audit, variable = NULL, type = c("count", "proportion"))Arguments
- audit
A
moat_auditobject.- variable
Optional single string naming a categorical variable audited by
check_design(). WhenNULL, the first audited batch variable is used; if no batch variable is available, the first categorical covariate is used.- type
A single string.
"count"plots raw sample counts and"proportion"plots proportions within each level ofvariable.
Value
A ggplot2::ggplot() object.